
Same Traffic, 60% More Revenue: The Secret Behind Strategic Merchandising
Alexander Jost
November 12, 2024
Send me this article
It all started with an unexpected call from one of our longest-standing customers who rarely shows stress.
"We've really tweaked every aspects of our customer journey," he said, "but we're still not where we need to be. We need to crack that $50 million target this year, and we can't afford to just throw more money at the problem. What should we do??"
We needed to squeeze out an additional 20% of performance to reach their goal. So we immediately started digging into the data, looking for potential levers. We had already worked on all the usual suspects – repurchase rates were up, AOV was solid, and the brand's LTV was beating the benchmarks. Spending more on acquisition wasn't really an option, as they had reached a point where that kind of additional scale would result in much higher CACs.
But I’ve noticed something interesting: Over 32% of the site-wide traffic was hitting collection pages – but they hadn’t been given much attention.
For almost every collection, I identified outperforming products (hidden champions) that were getting a lot of clicks even though they weren't in prime positions. On the other hand, some products that were getting the most impressions weren't performing as well.
People stopped browsing more often when there were a lot of poor performing products in the visible space. So good products didn't even get a chance to be seen by many people.
What if we could change the allocation of these products? – Give good products more visibility and bad products less.
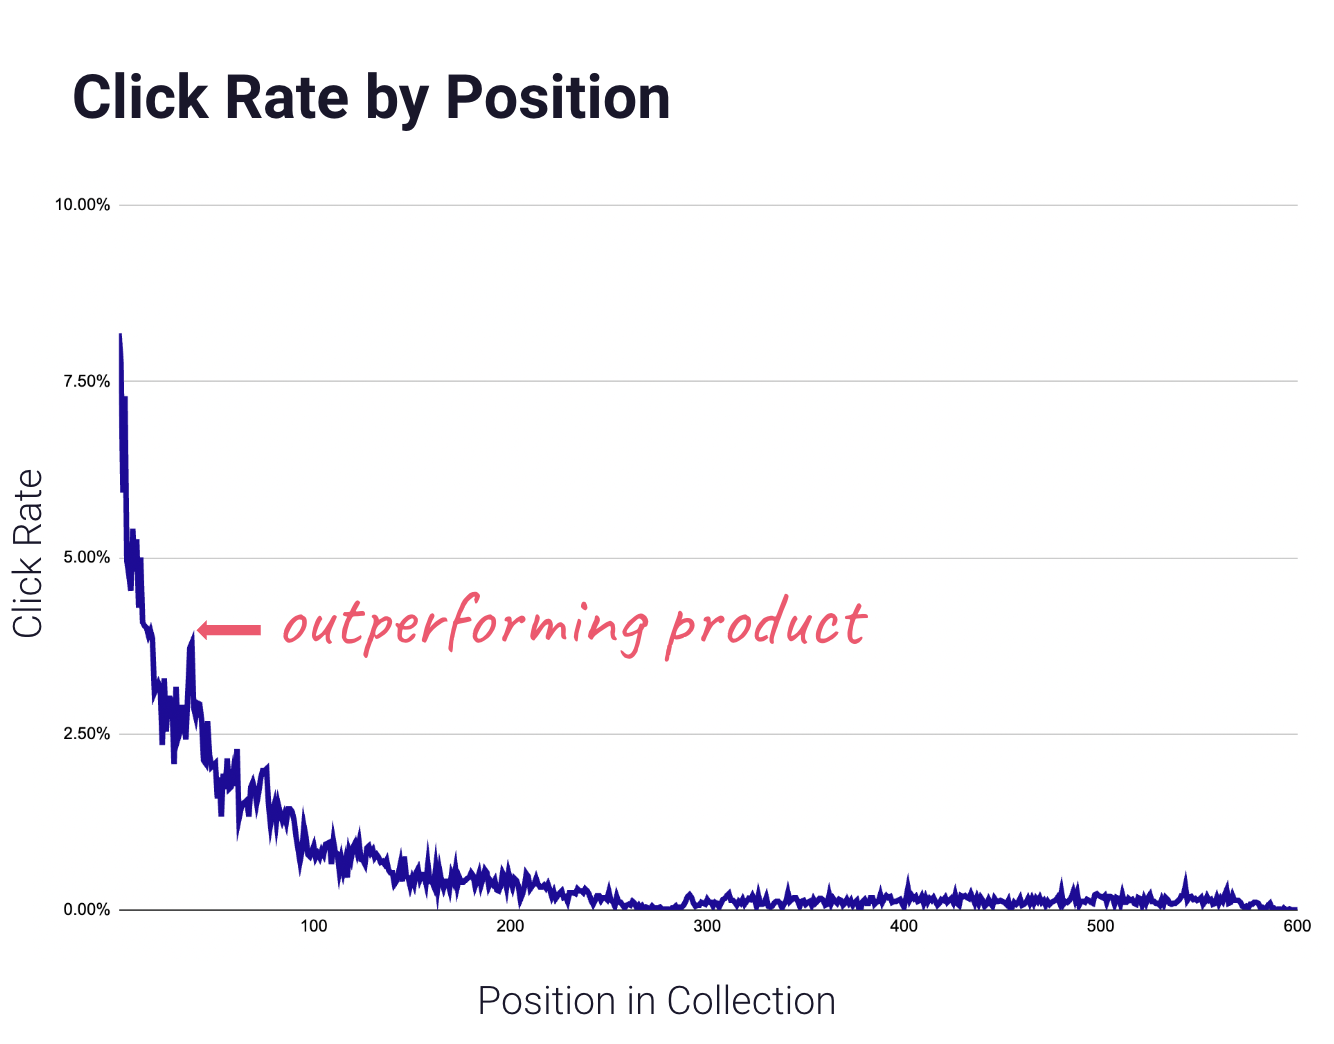
I ran the numbers, and there was an exponential distribution curve that was visible across all of the collections. Each position had it's unique value. The higher the position, the more visibility and clicks were generated.
The challenge now was to find those outliers and position them accordingly.
The real breakthrough came when I figured out how to use this data to improve product placement on collection pages.
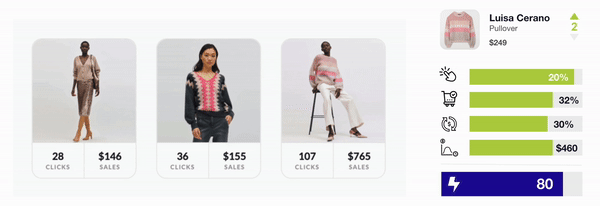
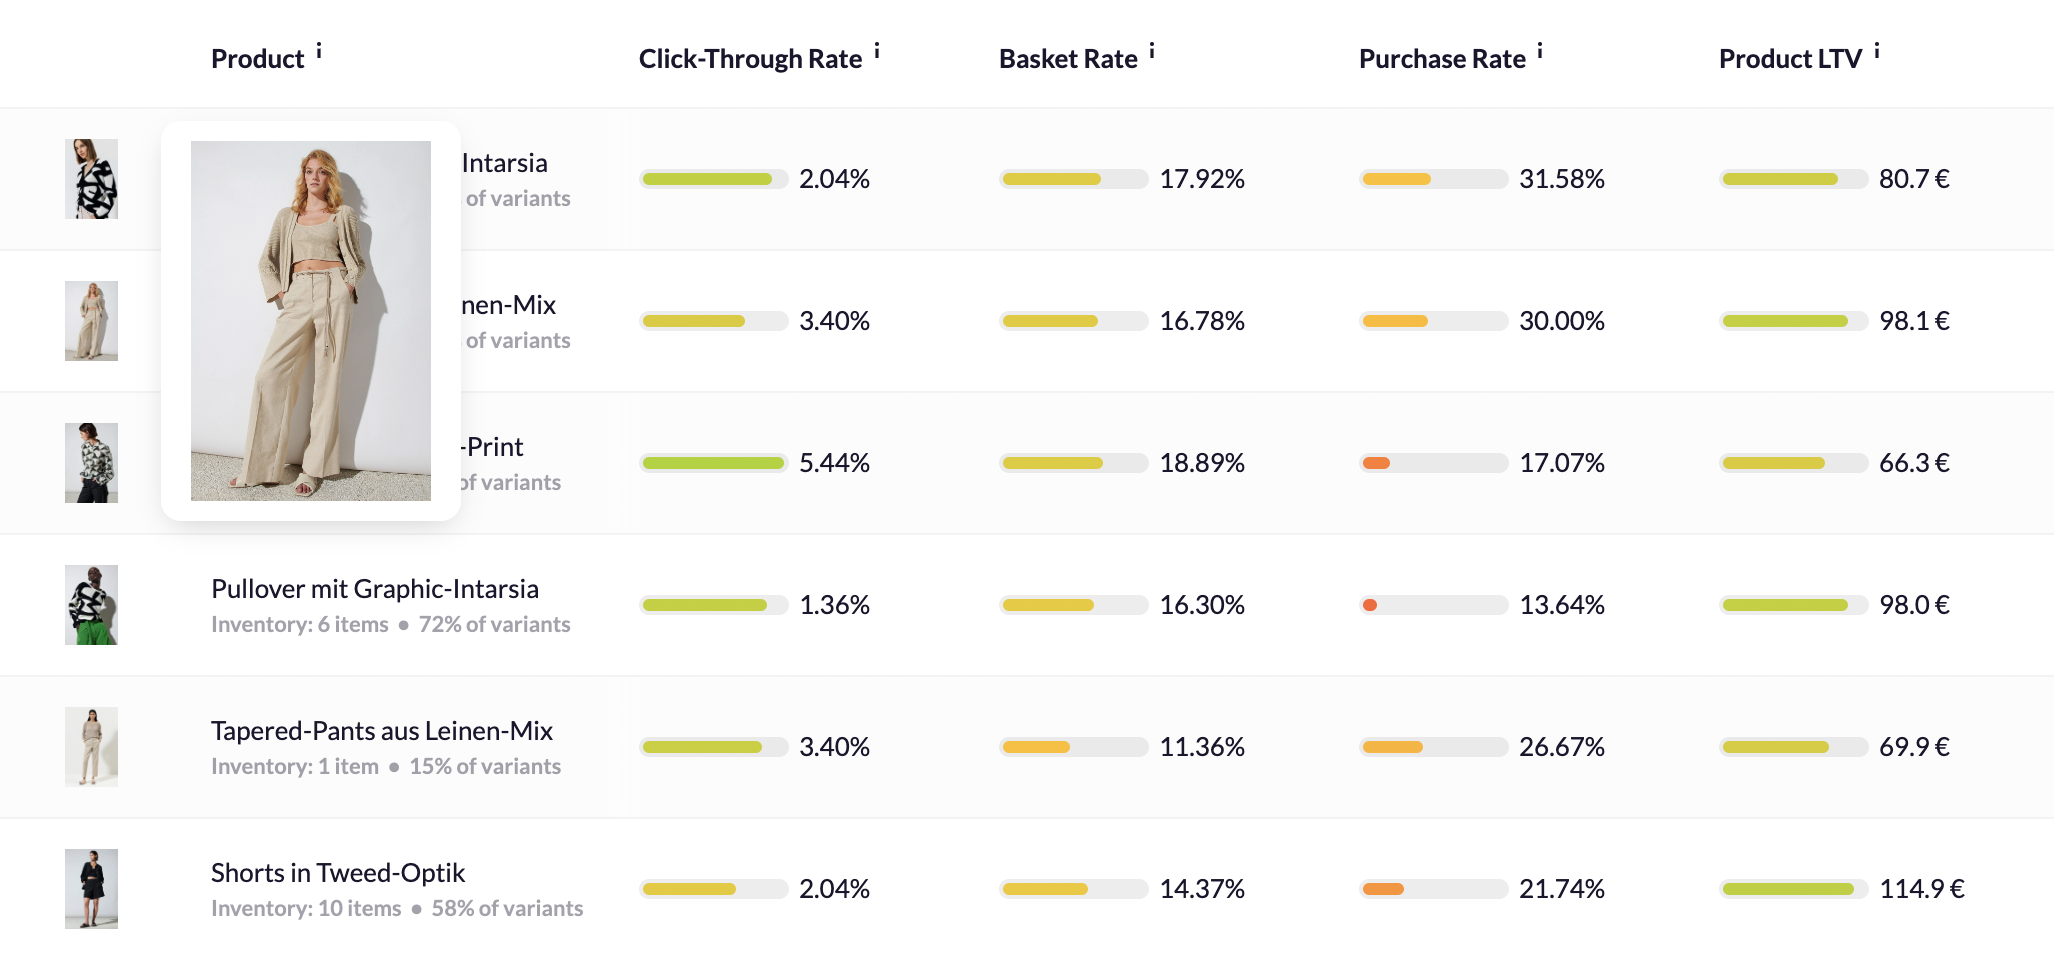
Advanced Performance Metrics: My approach went beyond just tracking clicks. I looked at these advanced performance metrics to get a full picture of how each product is doing:
- Clickrate by Position: This tells us which products are catching customers' eyes based on where they’re placed on the page. If a product isn’t getting enough attention, we can suggest moving it. The actual CTR of each product is compared against the expected CTR for each position.
- Basket Rate: Some products might be getting clicks, but they’re not converting into sales. This metric helps us spot those products and figure out why they’re not making it into customers’ baskets. If this number drops for a certain product, we should check the product detail page.
- Purchase Rate: We analyze if certain products get added to the basket but aren’t being purchased, helping refine pricing, shipping, and other strategies to close the sale.
- Product LTV: This metric looks at the long-term 90-day value of each product, considering item value, product returns, repeat purchases, and margins to ensure we’re not just boosting short-term sales or promoting cheap products but building sustainable growth.
These four metrics were fed into RetentionX's machine learning process to generate an AI-powered performance indicator, assigning scores from 0 to 100. Products that weren't performing well in their current spots received a low score, and the brand moved them to less prominent positions, freeing up space for the real stars — the products that exceeded expectations.
But what can you do about the low performers? One of the first ideas was to reshoot images for the low performers and test them again. The result? A 60% boost in conversion rates for most of those products. We were finally able to understand what was driving customer interest and using that to our advantage.
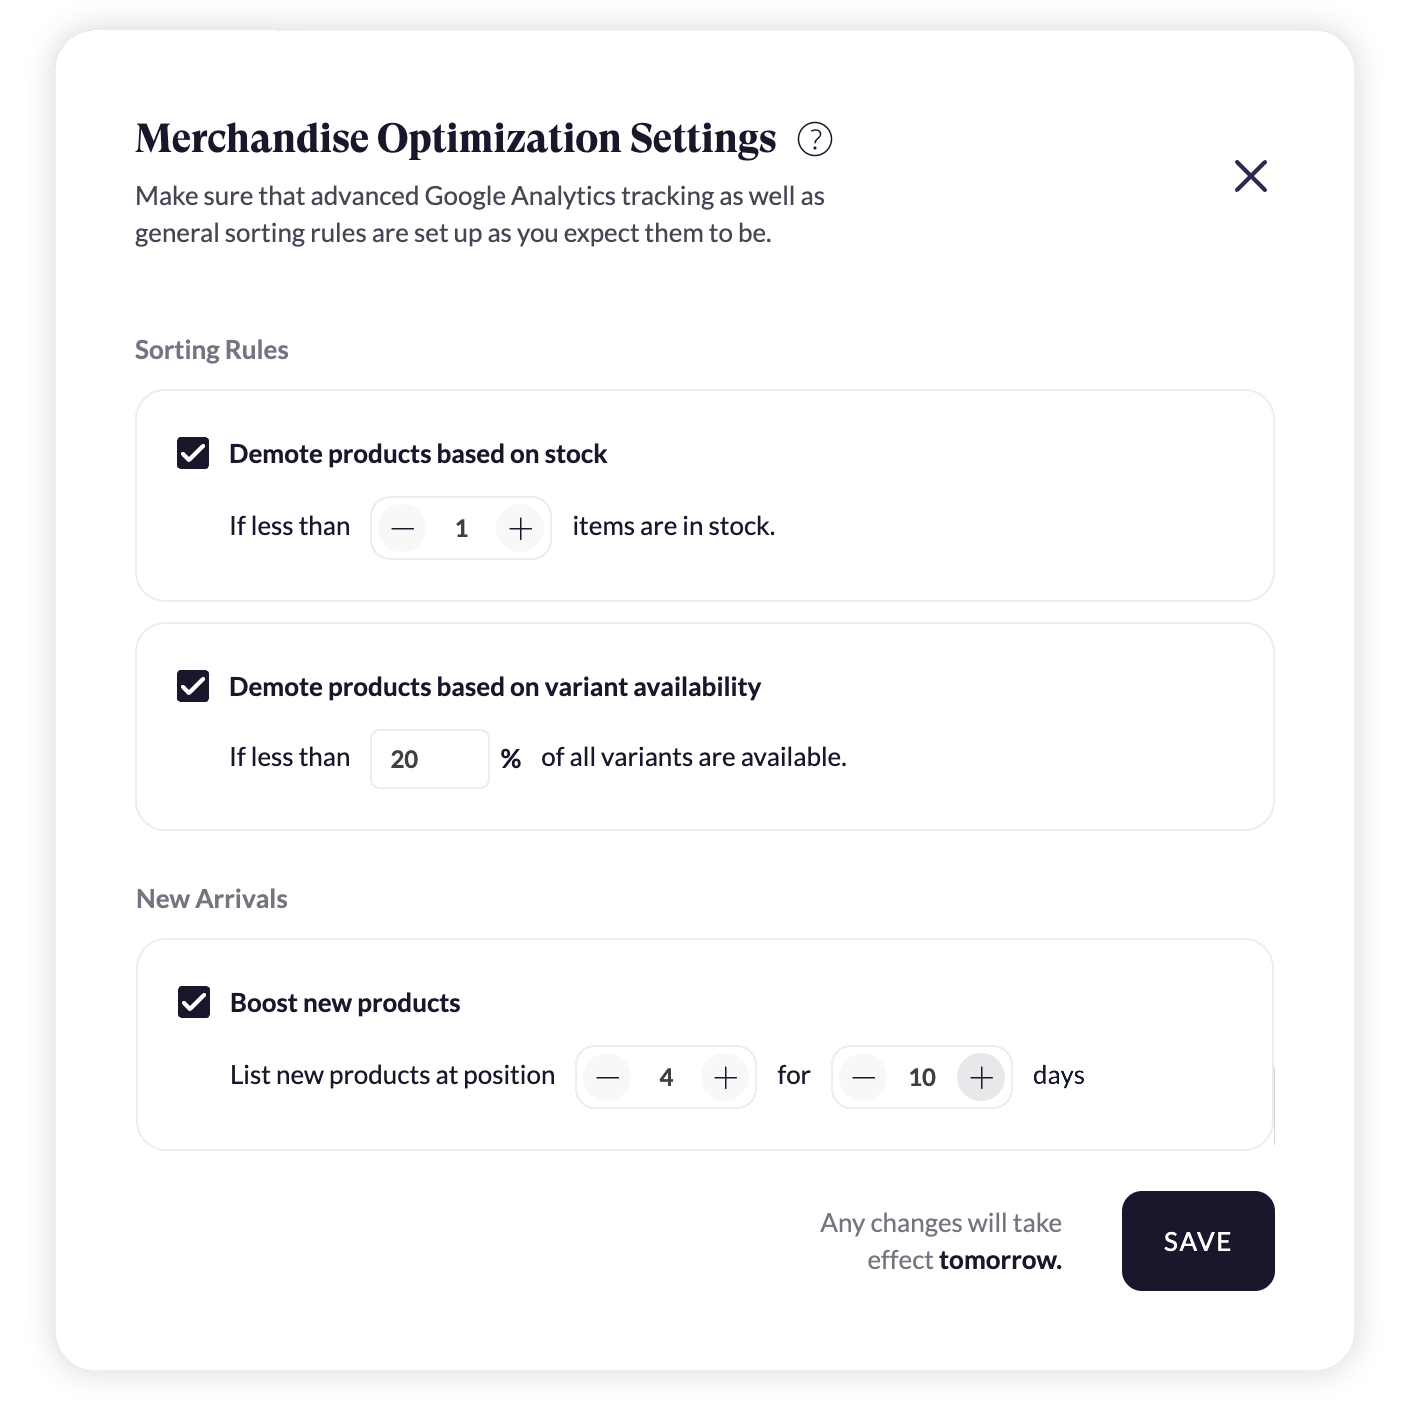
I realized that our manual, data-heavy process needed to run more or less constantly to maximize its effectiveness. Ideally, it needed to be built in such a way that other brands could benefit as well. That's when we decided to build a fully automated merchandising suite that constantly updates Shopify collections on its own.
With RetentionX Merchandise Optimization, we could finally see the performance of each collection - tracked every day.
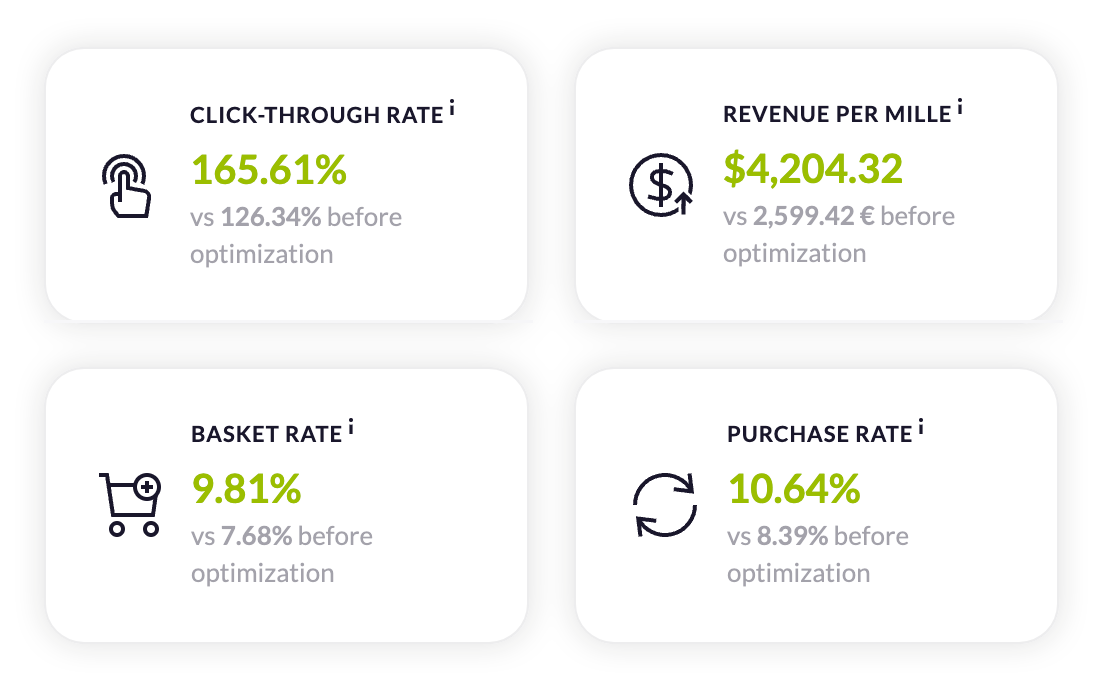
The CTR per collection showed the attractiveness of the assortment and gave direct guidance on where to direct traffic to maximize revenue.
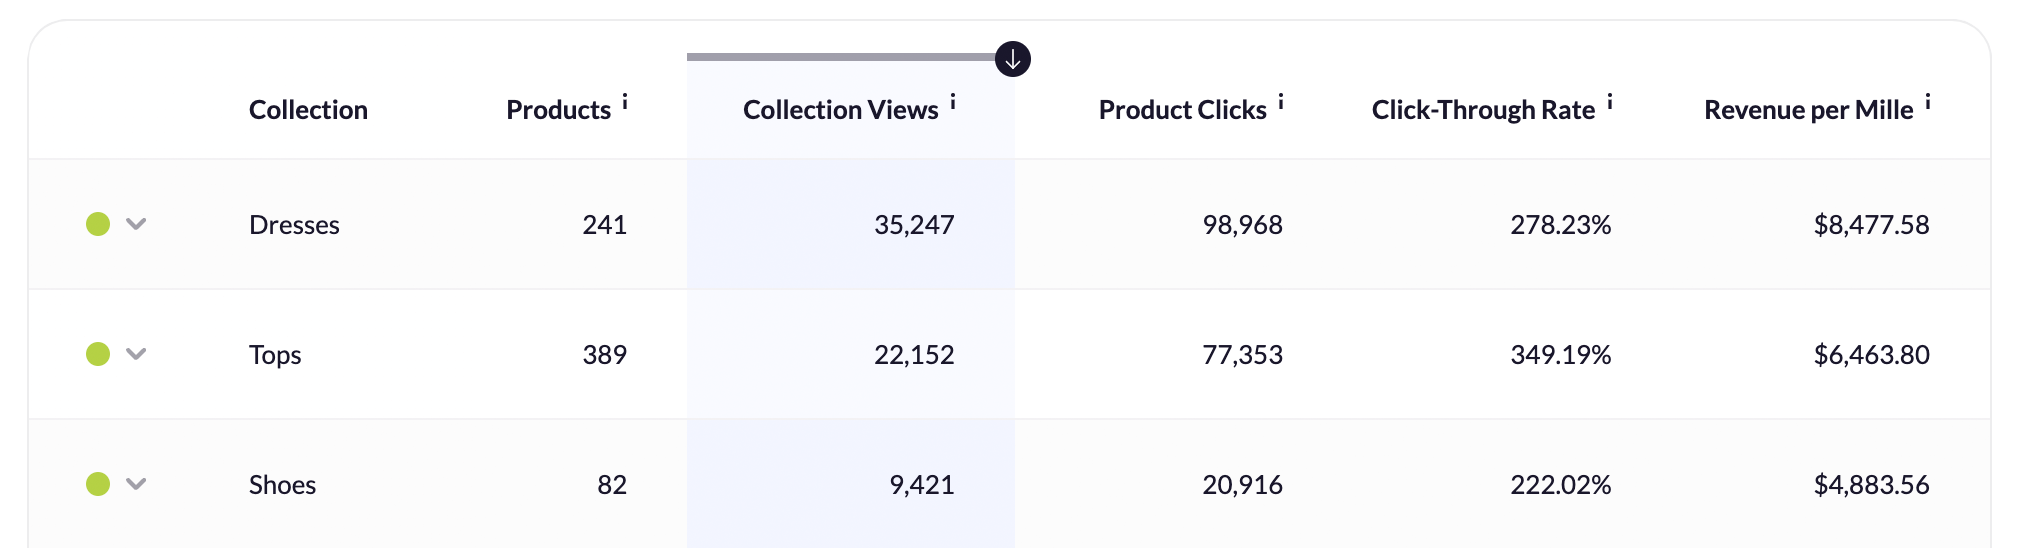
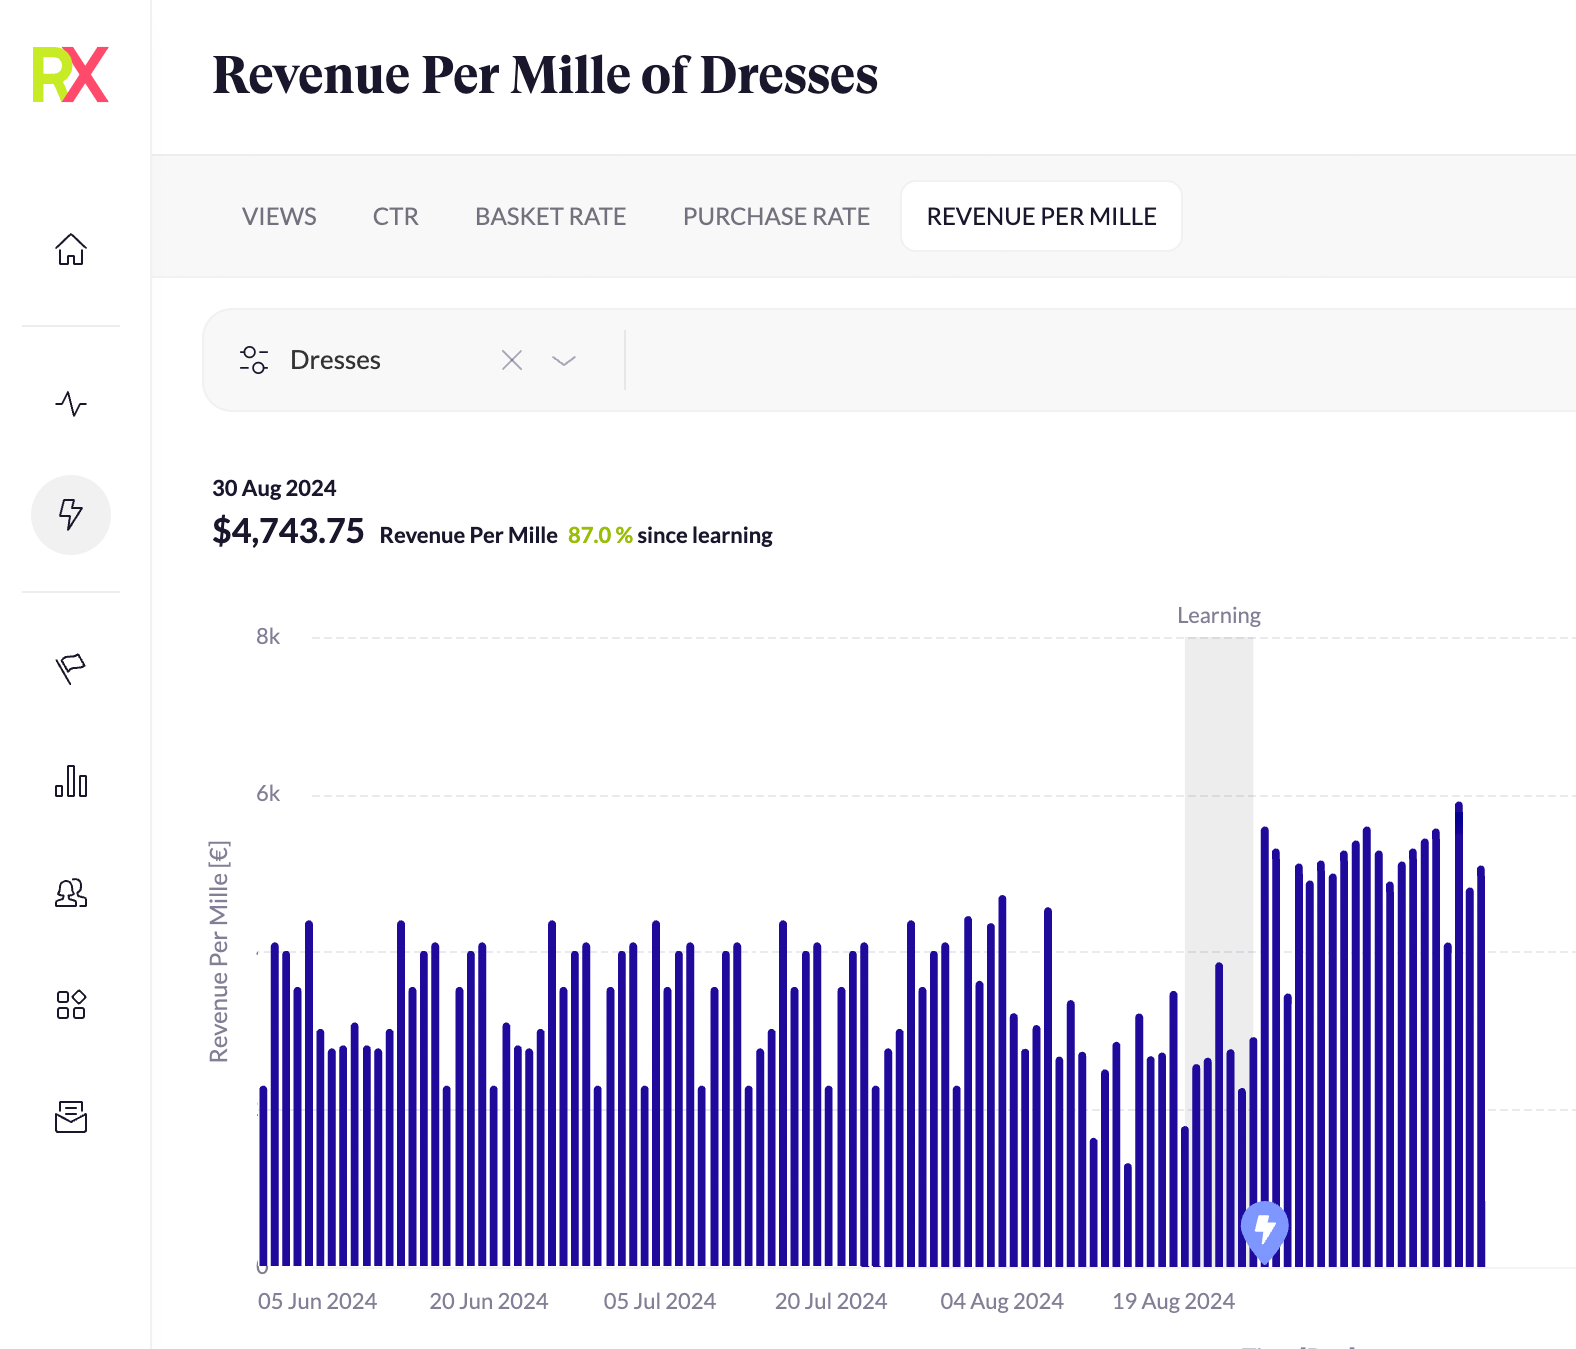
To track the performance of our changes, we introduced the new metric "Revenue per Mille" — tracking exactly how much revenue was generated per 1,000 impressions of a collection.
For the first time, our brands had a clear strategy for merchandising their products that went beyond intuition and visual appeal. They could combine our automated insights with their own logic for sorting products - like aligning email campaigns with what customers would see on the site, pushing new arrivals, and demoting low stock items.
And now here's the twist: Merchandising strategies such as color sorting and price anchoring often had a negative impact on collection performance. The data shows us what really matters in driving sales.
The changes we made had a noticeable impact. Collection pages, which had been somewhat overlooked, suddenly became the go-to place to track what was happening with their customers and how their products were being perceived.
The numbers told us we were on the right track, and remember, this is a $40M+ brand:
- 62% More Profit from the Same Traffic
- 27% Additional Increase in Revenue
- 23% Higher Conversion Rate
- 12% Increase in AOV
- 18% Increase in Basket Rates
These aren't just stats; they're proof that taking a fresh, data-driven look at product placement can lead to big results without spending more money.
Seeing how well this approach worked, we knew we couldn’t keep it to ourselves.
Our merchandising suite takes everything we learned and puts it into a system that can be customized for any brand or industry. Whether you need to adjust product placement based on performance, stock levels, prioritize new arrivals, or anything else, it’s all at your fingertips.
In order for RetentionX's strategic merchandising to create a similar effect for your brand, the following requirements must be met:
- Shopify preferred: Our automation works so far on Shopify (other platforms can use all analyses but not the automatic updates of the collection).
- 15+ Products / Collection: You should have at least 1 collection with more than 15 products.
- 500 Sessions per Day: You should have at least 500 sessions per day on your store – the more the better.
There is no maximum. The more products and/or collections, the higher the impact.
I know that’s a lot to take in! I’ve been in the same position—feeling overwhelmed about where to find the data, how to get started, and how to embed an LTV-driven mindset into my teams. That’s why we built RetentionX. It was my #1 internal tool as a brand operator to turn things around before launching it as publicly available software. All of the strategies above can easily be analyzed and implemented with RetentionX.